Improving Generalization in Reinforcement Learning with Mixture Regularization
| Kaixin Wang | Bingyi Kang | Jie Shao | Jiashi Feng |
| NUS | NUS | ByteDance AI Lab | NUS |
| [Paper] | [Code] |
Abstract
Deep reinforcement learning (RL) agents trained in a limited set of environments tend to suffer overfitting and fail to generalize to unseen testing environments. To improve their generalizability, data augmentation approaches (e.g. cutout and random convolution) are previously explored to increase the data diversity. However, we find these approaches only locally perturb the observations regardless of the training environments, showing limited effectiveness on enhancing the data diversity and the generalization performance. In this work, we introduce a simple approach, named mixreg, which trains agents on a mixture of observations from different training environments and imposes linearity constraints on the observation interpolations and the supervision (e.g. associated reward) interpolations. Mixreg increases the data diversity more effectively and helps learn smoother policies. We verify its effectiveness on improving generalization by conducting extensive experiments on the large-scale Procgen benchmark. Results show mixreg outperforms the well-established baselines on unseen testing environments by a large margin. Mixreg is simple, effective and general. It can be applied to both policy-based and value-based RL algorithms.
Increase training diversity
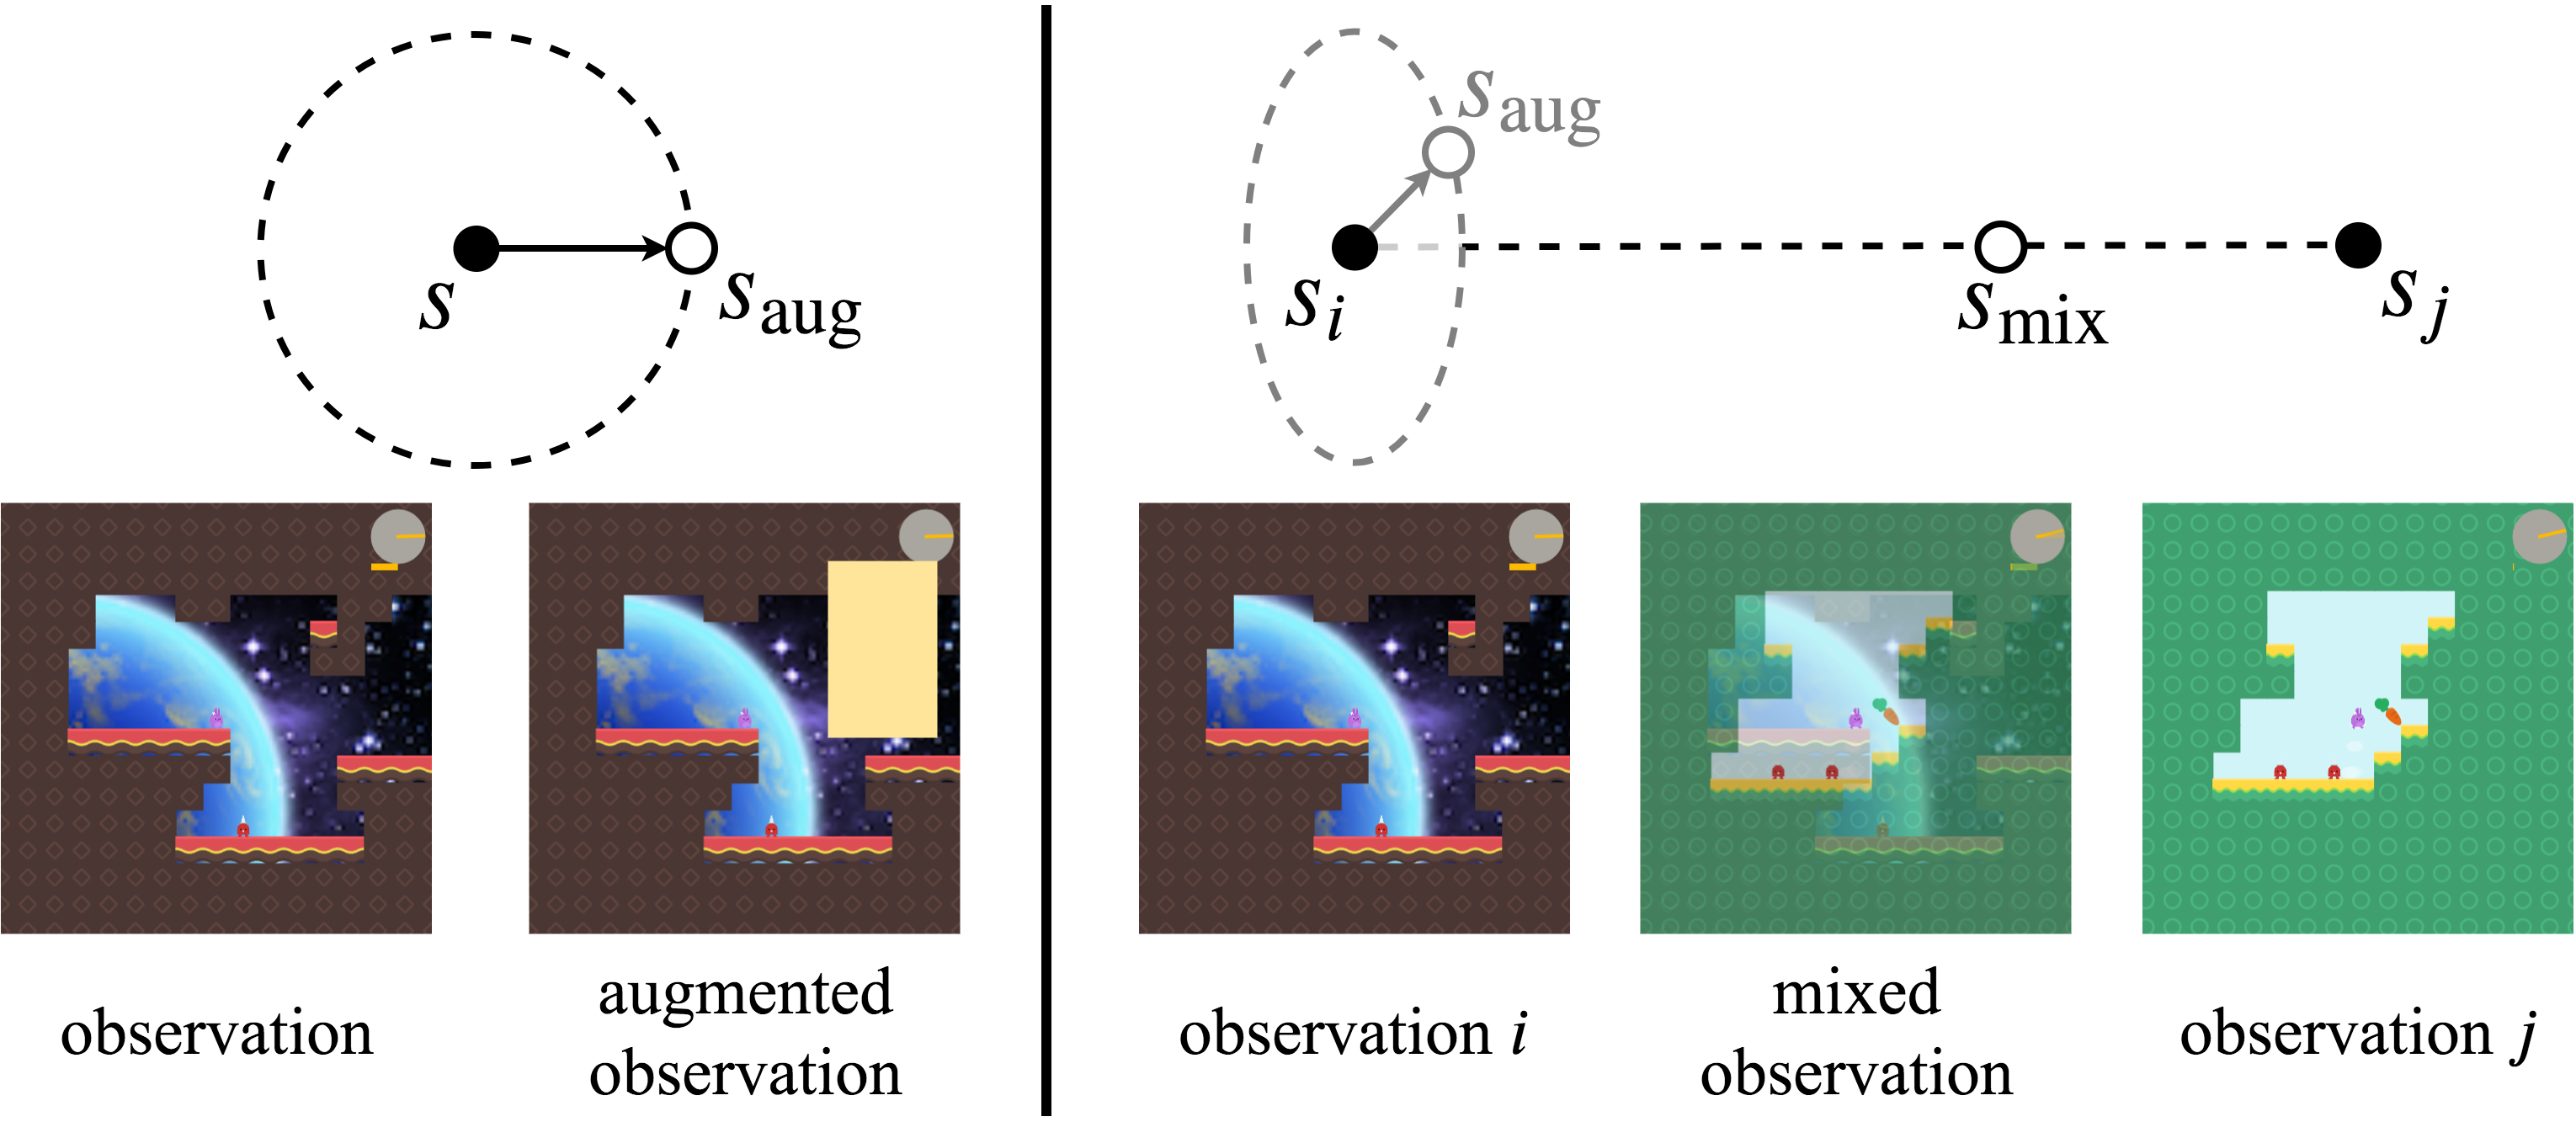
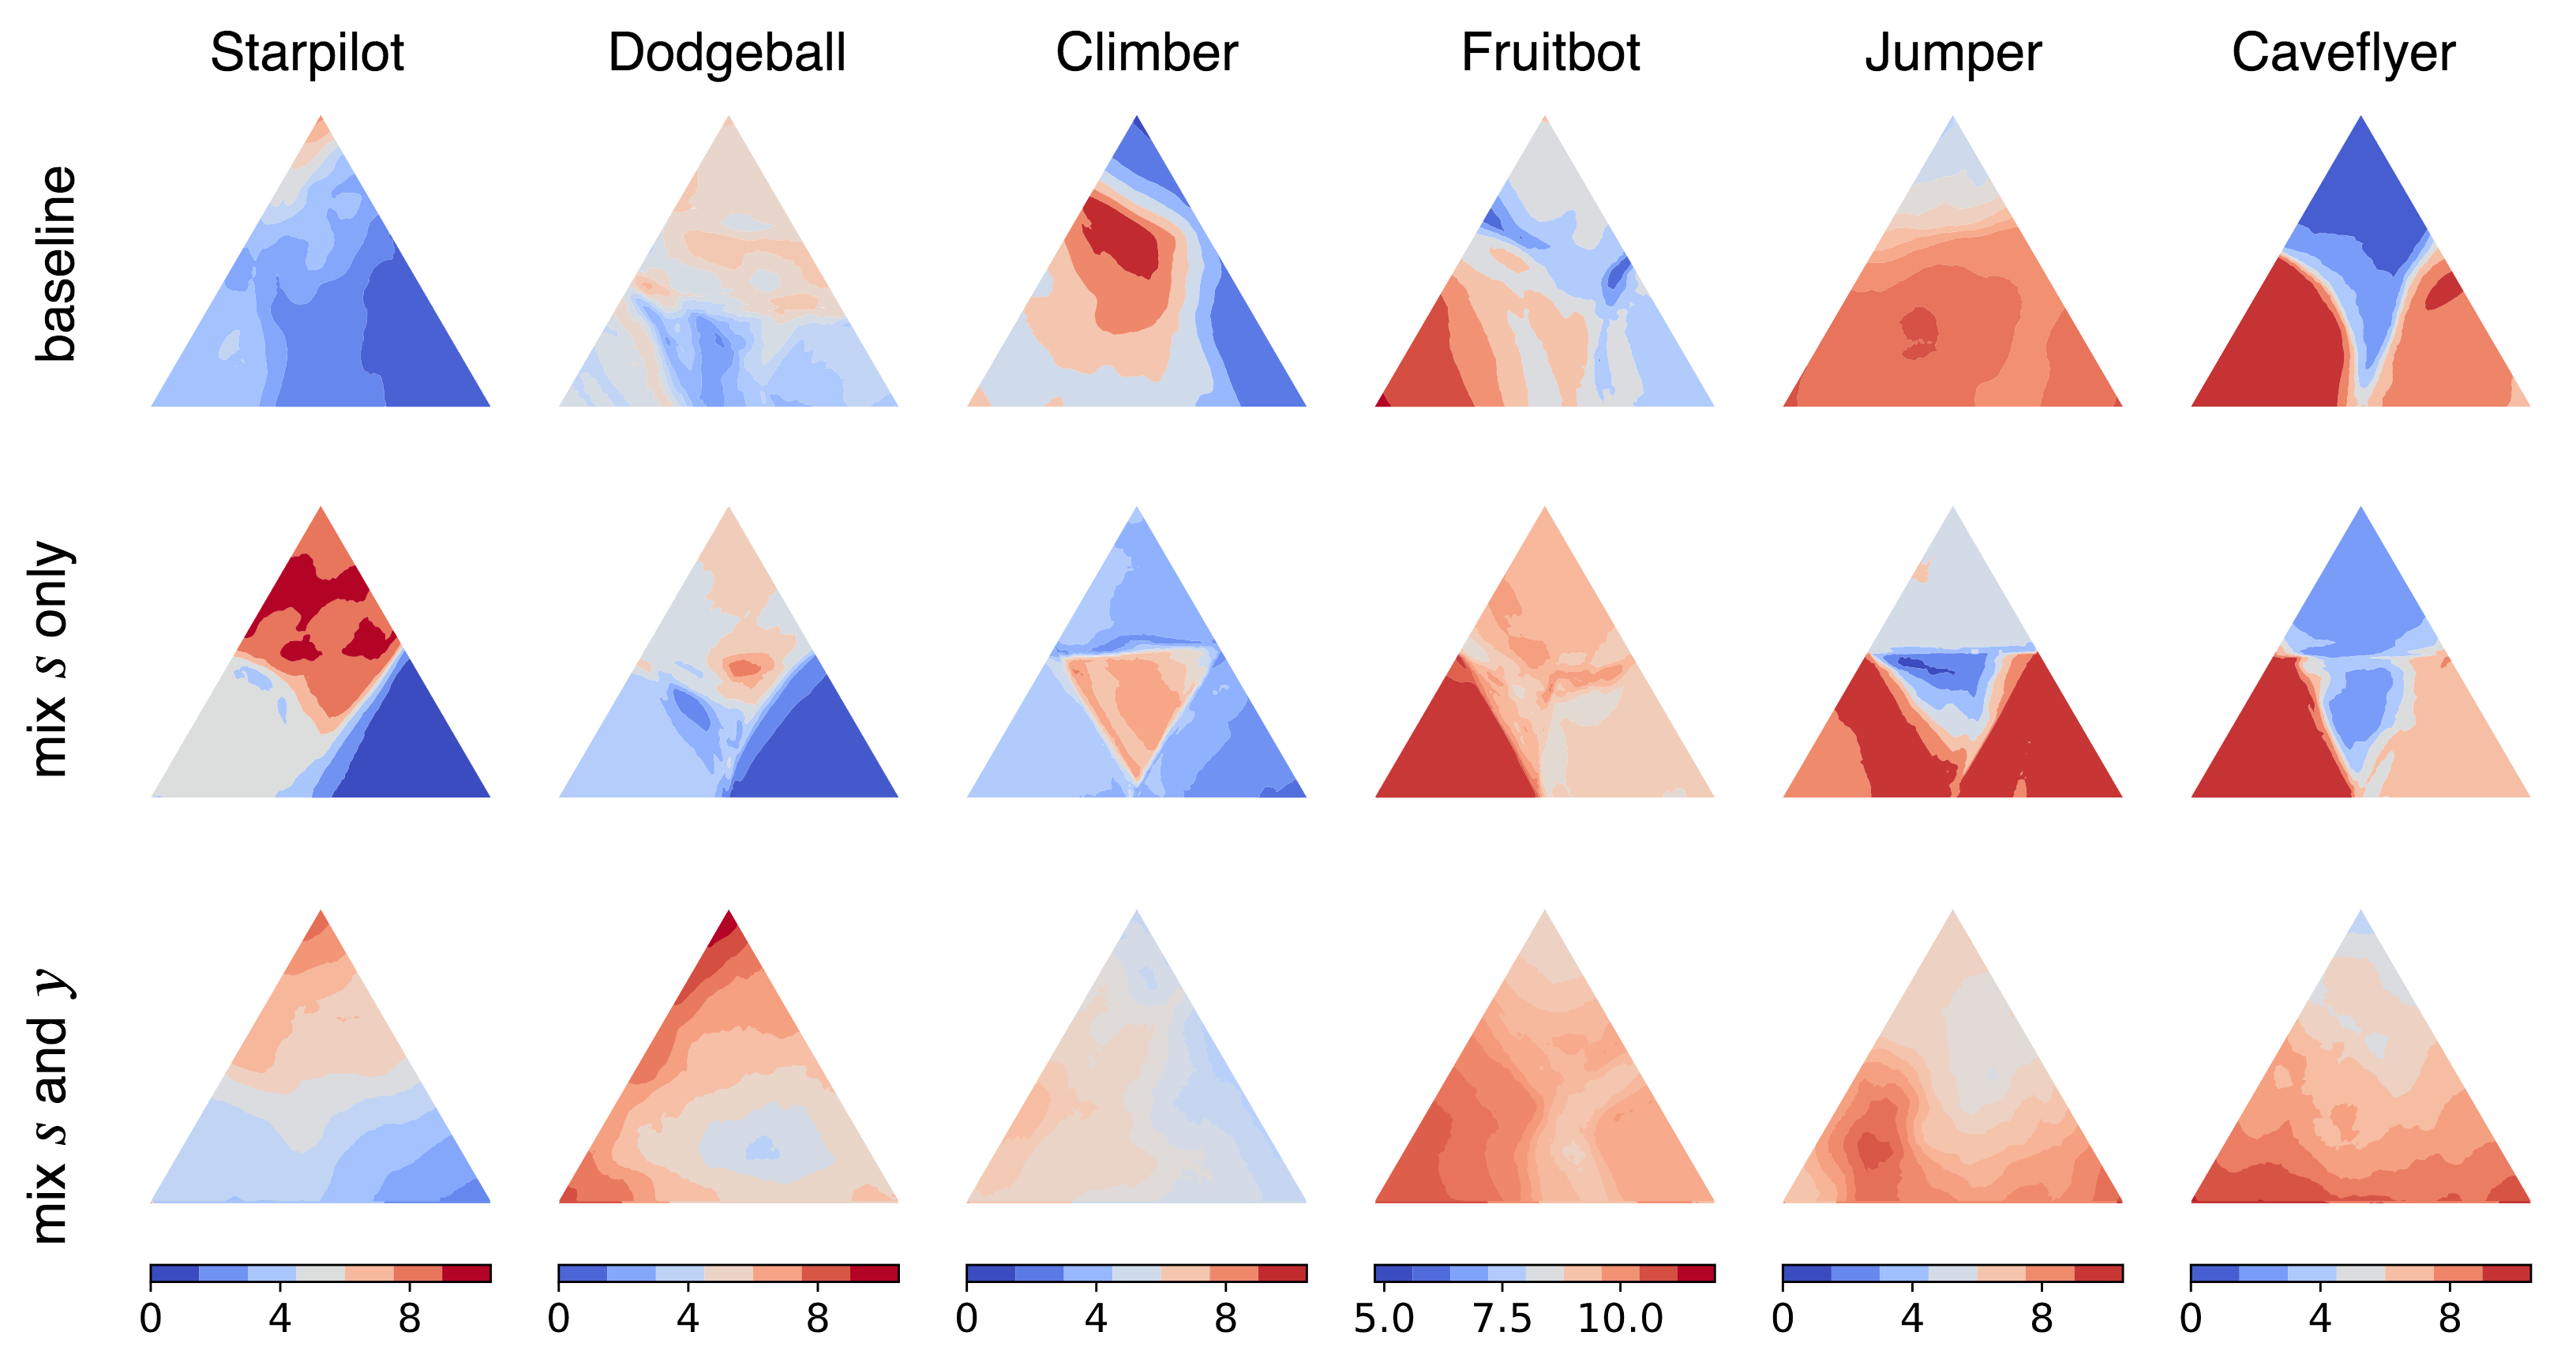
Previous data augmentation techniques (e.g. cutout) only apply local perturbations over the observation. They independently augment each observation regardless of training environments and achieve limited data diversity increment. Inspired by the success of mixup in supervised learning, we introduce mixture regularization (mixreg) to increase the training diversity via interpolating both observations and the associated supervision signals (e.g. reward). We find mixreg improves generalization on Procgen Benchmark and helps learn a smooth policy and value function. The figure below visualizes the learned value function. We plot the value predictions \(V(s)\) for observation \(s\) within the convex hull of three randomly selected observations from the testing environments.